(This is a sort-of sequel to my previous post at The growth of skylines)
Over the past months I've made a few posts regarding a personal project of mine I've been working on the past year, and now that 2020 is over I feel like I can finally present it. This project is an attempt to (1) quantify a suitable way to measure the size of a city's skyline, and (2) to measure how and how much it grows all the time. Each city is given a number that tells you how "big" its skyline is, or how "high-rise" the city is as a whole.
I call this the "Verticality Intensity Index" or the "Skyline Index" (I'm not sure which one sounds better), and I've shared the document here:

 docs.google.com
This contains information for over 1105 cities!
Try finding your own city and see how it grew over time. Is it growing at a pace you’d like?
As I've explained before, the number of points a city gets is obtained by summing up the number of points for each building over 10 stories in the city. (I've got to have a cutoff somewhere, right?) A 10 story building is worth 1 point, and a building has more points the taller it is.
Since it is more than twice as hard or expensive to build a building twice as tall, and such a building will have more than twice the proportional impact, the number of points increases polynomially. Specifically, the number of points is the cube of the number of floors divided by 10, so a 20 story building is worth 8 points, a 30 story building is worth 27 points, and so on.
If instead points were just proportional to floor count, a lot of cities that build 10-20 story residential towers would get more points than they would seem to have.
Almost all of this data is based on data from Emporis. I must note that Chinese cities in particular have atrocious levels of data, along with Iran and North Korea, and so the numbers of Chinese cities are severely lower than in actuality, perhaps even twice or three times as low, and data for cities below second-tier is almost non-existent. This is of course due to the restriction of information flow in the country itself. These numbers are in red to note their inaccuracy.
For other cities the data will always have inaccuracies, though the number I have is probably no more than 10% off than the true figure, since the tallest buildings are always included. The western nations likely have the best data, especially the US, and so their numbers are very accurate.
Although building data is available, there are always buildings whose year of construction is not known. To solve this, I look at the building data whose year is available and assume that the unknown points are distributed in the same way. This is of course not a perfect solution, but it'll have to do. The "unknown" column is how many points belong to buildings with an unknown year for each city.
Each number listed is for city proper, except for 4 exceptions. I've grouped the 4 communes that make up La Defénse in Paris together, and for Guadalajara, Monterrey and Puebla respectively I counted the buildings in Zapopan, San Pedro Garza Garcia and San Andrés Cholula together since these pairs of cities form a unified skyline.
I also have two columns that measure each city's growth in high-rises from 2010 to 2020. The estimated rate uses the distribution of unknown years measured above, and the minimum rate assumed all buildings with unknown years were built before 2020. Most skylines have grown, but some haven't at all, meaning they haven't built a single building above 10 floors after 2010.
There are many pieces of information that can be derived from this graph, such as the prevalence of high-rise buildings per capita. I should note that many cities score so highly because they have high-rises and skyscrapers all over the city, as in Seoul, Hong Kong, Moscow, Singapore, Kuala Lumpur, and Mumbai, as opposed to cities that only build high-rises in their centres, such as Chicago. To my eyes Chicago is a larger skyline than Seoul, but that is since a single picture of Seoul cannot capture how wide its skyline really is.
Throughout all of human history only two cities have ever held the top spot: New York City and Hong Kong, who usurped the throne from the 1990s onwards. Perhaps Shenzhen has overtaken HK already, but with the lack of data, we may never know.
I only included cities with over 100 points, since there are many more cities with just a few high-rise towers. To have 100 points, a city could have 100 ten-story buildings, 30 fifteen-story buildings, 13 twenty-story buildings, or a single 47-story building!
Top 10 largest skylines in the World - 2020
#1: Hong Kong
Points: 285,444.72+
# of 150m+ buildings: 491
2010-2020 growth rate: 10.68% to 11.20%
 Hong Kong #10 City skyline at sunset by P M, on Flickr
 Cityscape, Hong Kong by Johnny G Lee, on Flickr
Hong Kong has 40 floor+ buildings as a common occurrence in almost every neighbourhood outside of its smaller islands, with both public and private housing featuring estates of many of these buildings packed together. The main skyline is in Central and Tsim Sha Tsui, creating a striking visual contrast to the hills in the background. This ring of urbanity crawls around HK Island until it reaches Sai Wan Ho in the east. Kowloon is a dense concrete jungle, with many of the world's most crowded areas, such as Mong Kok and Sham Shui Po. Hong Kong's tallest building, the ICC, is located here on reclaimed land. But the real reason Hong Kong ranks so high is its numerous clusters of tall buildings that would rival ordinary cities by themselves, including Tseung Kwan O, Lohas Park, Tsuen Wan, Tuen Mun, Sha Tin, Yuen Long, Aberdeen, Wong Chuk Hang, Fanling, Kwai Tsing, Discovery Bay, and Tung Chung.
Lack of building space in Hong Kong Island and Kowloon is partly to blame for Hong Kong's slowing rate of construction, which has shifted to the dense suburbs mentioned above in the New Territories where space is more plentiful and the population is growing. I don't think there are virtually any sizeable plot sizes in HK Island where a 150m+ building would be possible unless Hong Kong goes the way of NYC and starts building pencil-thin towers.
#2: Seoul
Points: 143,137.95
# of 150m+ buildings: 142
2010-2020 growth rate: 40.20% to 40.60%
 Seoul city skyline by Patrick Foto
 ") , on Flickr
, on Flickr
Seoul's hilly terrain does not pose as much of a problem towards its high-rise growth as it does to Hong Kong. The city is virtually covered in high-rise residential buildings, owing to a Korean population very favourable towards apartment-style living. Seoul lacks distinctive high-rise clusters outside of its downtown core, with the Lotte World Tower jutting out abruptly amongst its cityscape. The picture gives you an idea of just how filled to the brim Seoul is with high-rises, stretching from horizon to horizon.
Many would voice disappointment at the dry character of Korean high-rises, which are quite repetitive in design and height, and mostly coloured with dull whites or greens. Additionally most of them fall between 20 to 40 stories, not tall enough to be proper skyscrapers. But this is likely changing. The pace of Seoul's construction can be attested by a scroll through the "high-rise" section on the SSC forum, most of which are groups of residential buildings, with better designs in their facades and window patterns. I will be awaiting the day where single-building residential developments become popular in SK.
#3: New York City
Points: 99,322.60
# of 150m+ buildings: 284
2010-2020 growth rate: 33.78% to 33.91%
 New York City by NyConstructionPhoto, on Flickr
Manhattan by Dariusz Chelstowski on 500px
Once the largest city on the planet, New York has adapted, adopted, and pioneered the skyscraper, ushering in a new era of urbanization. The centre of global finance, commerce, media, and culture, New York reigned supreme as the world's largest skyline until the 1990s. These past 10 years have seen a change unlike any other the city has seen before. To name a few: the completion of One World Trade Centre, One Vanderbilt, the enormous Hudson Yards complex, the pencil-thin skyscrapers along billionaire's row - adding up to the largest absolute point increase since the city's inception.
Until recently the vast majority of New York's high-rises were in Manhattan, the apex of urban development. This is despite Manhattan's population being below its former peak in 1910. Brooklyn and Queens, now with more people, are developing skylines of their own, in DoBro and Long Island City. In a similar fashion, nearby Jersey City has boomed in an unprecedented manner. This will likely continue into the 2020s as these boroughs have the population base to support such development, while the Bronx may see a boom of its own. The future of NYC, despite the pandemic, remains bright, and the many supertalls in the proposal stage will likely see fruition. Other large developments such as Sunnyside Yards are also taking shape.
#4: Shenzhen
Points: 96,239.65
# of 150m+ buildings: 517
2010-2020 growth rate: 227.29% to 272.94%
![Image]()
From Flat on 500px
If I actually had accurate data, Shenzhen would have a decent chance of being #1 on this list. This juggernaut of a city took the title of China's largest skyline from Shanghai, and is not looking back. For years Shenzhen was the fastest-growing city in the world, and now its skyline is the fastest growing (in absolute terms) - the city of 12 million sits at the nexus of the Pearl River Delta, an urban area of over 70 million. Trade and proximity to Hong Kong, its special economic status, its port, and huge amounts of investment propelled this 50-year old city to first-tier status, and the city is a major global high-tech hub, hosting the headquarters of Huawei and DJI.
Shenzhen's tallest skyscrapers are located in its downtown right near the border of Hong Kong, in Nanshan, Luohu, and Futian. A single picture does not do this city justice. At night, Shenzhen transforms into a cyberpunk utopia of neon light shows, billboards, and streets. With a whopping 14 supertalls under construction, it seems nothing can stop Shenzhen from becoming the world's premier skyline.
#5: Busan
Points: 95,897.18
# of 150m+ buildings: 103
2010-2020 growth rate: 84.13% to 84.96%
 Busan by Jens-Olaf Walter, on Flickr
At first glance and many glances after that, Busan looks like it should not be on this list. This city of under 4 million people manages to boast 103 skyscrapers and 4 supertalls - a very impressive feat. Despite Busan's steady or declining population it managed to almost double the size of its skyline. Perhaps this panorama on Wikipedia will give one an idea of how expansive its city is.
Thanks to its coastal location Busan's skyline gives the impression of being more appealing to look at than Seoul's. Like Seoul, many of Busan's towers are residential towers located away from the city. Busan's most prominent cluster is located in Haeundae, a rich coastal community near Haeundae Beach, one of Korea's most popular beaches. This has led to high real estate prices, prompting the development of Marine City and Centum City, two of Busan's most prominent developments. The line of towers stretching along the beach is reminiscent of many other beach resort towns, particularly Brazil's Balneario Camboriu.
#6: Moscow
Points: 74,613.19
# of 150m+ buildings: 44
2010-2020 growth rate: 45.97% to 46.69%
 Moscow by Sergey Aleshchenko, on Flickr
Russia's capital has a surprisingly long history with skyscrapers. Thanks to its Soviet past, miles of concrete apartments dot the Moscow cityscape that provide Muscovites with a place to live. These "commieblocks" can be easy to miss when glancing at the newer MIBC district. Moscow is vast in expanse, and much like Seoul, apartments can be found far, far away from the city centre, as shown here, here, or here. But before 2000, the real star of Moscow's skyline where the "Seven Sisters", seven iconic Stalinist-era skyscrapers built from 1947 to 1953. In particular, the Moscow State University, the tallest of these, is a staggering (at the time) 240 meters tall.
After the fall of the USSR the conception of the MIBC came into being, and produced what is definitively Europe's tallest skyline. At first a sparse collection of business towers, through the 2010s it continued to grow in scale and scope, perhaps in contrast to Russia's fluctuating economy. At the same time, Moscow began a major revitalization program throughout the city that transformed its streets, parks, greatly increasing the quality of life in the city - and taller residential complexes, ones with distinct, bold, and unique designs - are becoming commonplace. With the MIBC still realizing its gigantic expansion plan, the future for Moscow is an exciting one.
#7: Singapore
Points: 69,660.63
# of 150m+ buildings: 103
2010-2020 growth rate: 49.86% to 63.07%
![Image]()
Singapore is much like its fellow financial hub Hong Kong in many ways. Both are politically and geographically restricted from the development of low-density or medium-density suburban development. Unlike Hong Kong, however, Singapore is much flatter, leading to a sea of high-rises that cover the island. Also unlike Hong Kong is the success of the local housing agency, the HDB, which tends to build towers with more colorful, dynamic, and variable (though not as tall) designs than the public housing blocks of HK or the towers of South Korea. Outside of Singapore's Central Area are more high-rises and even more high-rises (as seen in the picture), all the way north up to Sembawang.
This altogether makes Singapore's skyline quite pleasant when viewed from different angles. The Central Area has continued to develop, with the tallest building, Guoco tower, built in 2016. While its birth rate is quite low, Singapore is not burdened by geopolitical tensions like HK, and its economy, and therefore skyline, will likely continue to grow.
However, Singapore is the first city on this list to have no supertalls at all, due to the unfortunate height limit of 280 meters in the Central Area, which the U/C CapitaSpring will match. I don't see this changing soon, unless Singapore makes the wise decision to remove it in the 2020s.
#8: Incheon
Points: 68,550.61
# of 150m+ buildings: 136
2010-2020 growth rate: 125.54% to 125.97%
![Image]()
Yes, yes, I know what you're thinking. Another South Korean city? This surprisingly tall city is Seoul's largest suburb, and home to its main international airport. Incheon itself is also quite big, and is a lot like an extension of Seoul, though its buildings are mostly newer. Thus, Incheon lacks the flatter, wall-like apartment blocks of the 1970s, giving the city a modern look. Some proportion of these points come from the Songdo International Business District (shown in the picture) where its sole supertall is located.
Even in the picture above one can glance the high-rises faraway in classical Korean fashion, and it is this proliferation of high-rises that earns Incheon a mighty 68,000 points.
#9: Chongqing
Points: 67,910.58
# of 150m+ buildings: 184
2010-2020 growth rate: 90.86% to 108.20%
 Chongqing by Daniel Cheong, on Flickr
While not actually China's biggest city, Chongqing is a huge economic hub in Southwestern China, attracting rural migrants from its municipality and from Sichuan elsewhere. Its intense high-rise development is a product of its geography, with the Yuzhong district, where the Jiefangbei CBD is located, surrounded by water on 3 sides. Furthermore, Chongqing is notably hilly city even by Chinese standards, with buildings having two entrances on different levels and trains going through buildings. This unique cityscape gives Shenzhen a run for its money, with Chongqing looking just as futuristic at night.
With its expanding population and burgeoning economy, Chongqing's skyline will keep growing for decades to come.
#10: São Paulo
Points: 65,029.86
# of 150m+ buildings: 15
2010-2020 growth rate: 21.67% to 32.67%
 São Paulo Skyline III by Henrique Oliveira, on Flickr
One may notice that São Paulo has a significantly lower number of 150m+ skyscrapers when compared to other buildings on this list. This is despite it looking like, and being, a concrete jungle. This will change in the coming years as the Brazilian megacity builds its tallest building, Figuiera reaching a respectable 180m+ meters. This developmental pattern typical of Brazilian cities as a whole, which are reluctant to build at taller heights despite living in cities that could easily support such towers economically, and with a populace that is attuned to living in apartments.
While these 10-30 story buildings fill the Sao Paulo cityscape in a similar manner to the ones of South Korea, the smaller width and footprint of Sao Paulo becomes apparent. Coupled with the fact that each building in Brazil is often a single development, the more vibrant, colourful, dizzying, and chaotic urban landscape of Sao Paulo is seen only in other Brazilian cities, and none with the immense scale that Sao Paulo boasts.
The direction that Sao Paulo's skyline takes in the future is affected by the city's growth rate, which remains respectable but is slower than its smaller Brazilian alternatives, as well as the economic situation in Brazil. I do hope to see a 200m+ skyscraper in Sao Paulo in the near future.
Feel free to check the document for the history of a city's skyline - I'll certainly add more of these descriptions in the future!
Over the past months I've made a few posts regarding a personal project of mine I've been working on the past year, and now that 2020 is over I feel like I can finally present it. This project is an attempt to (1) quantify a suitable way to measure the size of a city's skyline, and (2) to measure how and how much it grows all the time. Each city is given a number that tells you how "big" its skyline is, or how "high-rise" the city is as a whole.
I call this the "Verticality Intensity Index" or the "Skyline Index" (I'm not sure which one sounds better), and I've shared the document here:
Skyline: Index
This contains information for over 1105 cities!
Try finding your own city and see how it grew over time. Is it growing at a pace you’d like?
As I've explained before, the number of points a city gets is obtained by summing up the number of points for each building over 10 stories in the city. (I've got to have a cutoff somewhere, right?) A 10 story building is worth 1 point, and a building has more points the taller it is.
Since it is more than twice as hard or expensive to build a building twice as tall, and such a building will have more than twice the proportional impact, the number of points increases polynomially. Specifically, the number of points is the cube of the number of floors divided by 10, so a 20 story building is worth 8 points, a 30 story building is worth 27 points, and so on.
If instead points were just proportional to floor count, a lot of cities that build 10-20 story residential towers would get more points than they would seem to have.
Almost all of this data is based on data from Emporis. I must note that Chinese cities in particular have atrocious levels of data, along with Iran and North Korea, and so the numbers of Chinese cities are severely lower than in actuality, perhaps even twice or three times as low, and data for cities below second-tier is almost non-existent. This is of course due to the restriction of information flow in the country itself. These numbers are in red to note their inaccuracy.
For other cities the data will always have inaccuracies, though the number I have is probably no more than 10% off than the true figure, since the tallest buildings are always included. The western nations likely have the best data, especially the US, and so their numbers are very accurate.
Although building data is available, there are always buildings whose year of construction is not known. To solve this, I look at the building data whose year is available and assume that the unknown points are distributed in the same way. This is of course not a perfect solution, but it'll have to do. The "unknown" column is how many points belong to buildings with an unknown year for each city.
Each number listed is for city proper, except for 4 exceptions. I've grouped the 4 communes that make up La Defénse in Paris together, and for Guadalajara, Monterrey and Puebla respectively I counted the buildings in Zapopan, San Pedro Garza Garcia and San Andrés Cholula together since these pairs of cities form a unified skyline.
I also have two columns that measure each city's growth in high-rises from 2010 to 2020. The estimated rate uses the distribution of unknown years measured above, and the minimum rate assumed all buildings with unknown years were built before 2020. Most skylines have grown, but some haven't at all, meaning they haven't built a single building above 10 floors after 2010.
There are many pieces of information that can be derived from this graph, such as the prevalence of high-rise buildings per capita. I should note that many cities score so highly because they have high-rises and skyscrapers all over the city, as in Seoul, Hong Kong, Moscow, Singapore, Kuala Lumpur, and Mumbai, as opposed to cities that only build high-rises in their centres, such as Chicago. To my eyes Chicago is a larger skyline than Seoul, but that is since a single picture of Seoul cannot capture how wide its skyline really is.
Throughout all of human history only two cities have ever held the top spot: New York City and Hong Kong, who usurped the throne from the 1990s onwards. Perhaps Shenzhen has overtaken HK already, but with the lack of data, we may never know.
I only included cities with over 100 points, since there are many more cities with just a few high-rise towers. To have 100 points, a city could have 100 ten-story buildings, 30 fifteen-story buildings, 13 twenty-story buildings, or a single 47-story building!
Top 10 largest skylines in the World - 2020
#1: Hong Kong
Points: 285,444.72+
# of 150m+ buildings: 491
2010-2020 growth rate: 10.68% to 11.20%
Hong Kong #10 City skyline at sunset by P M, on FlickrCityscape, Hong Kong by Johnny G Lee, on FlickrHong Kong has 40 floor+ buildings as a common occurrence in almost every neighbourhood outside of its smaller islands, with both public and private housing featuring estates of many of these buildings packed together. The main skyline is in Central and Tsim Sha Tsui, creating a striking visual contrast to the hills in the background. This ring of urbanity crawls around HK Island until it reaches Sai Wan Ho in the east. Kowloon is a dense concrete jungle, with many of the world's most crowded areas, such as Mong Kok and Sham Shui Po. Hong Kong's tallest building, the ICC, is located here on reclaimed land. But the real reason Hong Kong ranks so high is its numerous clusters of tall buildings that would rival ordinary cities by themselves, including Tseung Kwan O, Lohas Park, Tsuen Wan, Tuen Mun, Sha Tin, Yuen Long, Aberdeen, Wong Chuk Hang, Fanling, Kwai Tsing, Discovery Bay, and Tung Chung.
Lack of building space in Hong Kong Island and Kowloon is partly to blame for Hong Kong's slowing rate of construction, which has shifted to the dense suburbs mentioned above in the New Territories where space is more plentiful and the population is growing. I don't think there are virtually any sizeable plot sizes in HK Island where a 150m+ building would be possible unless Hong Kong goes the way of NYC and starts building pencil-thin towers.
#2: Seoul
Points: 143,137.95
# of 150m+ buildings: 142
2010-2020 growth rate: 40.20% to 40.60%
Seoul city skyline by Patrick Foto , on FlickrSeoul's hilly terrain does not pose as much of a problem towards its high-rise growth as it does to Hong Kong. The city is virtually covered in high-rise residential buildings, owing to a Korean population very favourable towards apartment-style living. Seoul lacks distinctive high-rise clusters outside of its downtown core, with the Lotte World Tower jutting out abruptly amongst its cityscape. The picture gives you an idea of just how filled to the brim Seoul is with high-rises, stretching from horizon to horizon.
Many would voice disappointment at the dry character of Korean high-rises, which are quite repetitive in design and height, and mostly coloured with dull whites or greens. Additionally most of them fall between 20 to 40 stories, not tall enough to be proper skyscrapers. But this is likely changing. The pace of Seoul's construction can be attested by a scroll through the "high-rise" section on the SSC forum, most of which are groups of residential buildings, with better designs in their facades and window patterns. I will be awaiting the day where single-building residential developments become popular in SK.
#3: New York City
Points: 99,322.60
# of 150m+ buildings: 284
2010-2020 growth rate: 33.78% to 33.91%
New York City by NyConstructionPhoto, on FlickrManhattan by Dariusz Chelstowski on 500px
Once the largest city on the planet, New York has adapted, adopted, and pioneered the skyscraper, ushering in a new era of urbanization. The centre of global finance, commerce, media, and culture, New York reigned supreme as the world's largest skyline until the 1990s. These past 10 years have seen a change unlike any other the city has seen before. To name a few: the completion of One World Trade Centre, One Vanderbilt, the enormous Hudson Yards complex, the pencil-thin skyscrapers along billionaire's row - adding up to the largest absolute point increase since the city's inception.
Until recently the vast majority of New York's high-rises were in Manhattan, the apex of urban development. This is despite Manhattan's population being below its former peak in 1910. Brooklyn and Queens, now with more people, are developing skylines of their own, in DoBro and Long Island City. In a similar fashion, nearby Jersey City has boomed in an unprecedented manner. This will likely continue into the 2020s as these boroughs have the population base to support such development, while the Bronx may see a boom of its own. The future of NYC, despite the pandemic, remains bright, and the many supertalls in the proposal stage will likely see fruition. Other large developments such as Sunnyside Yards are also taking shape.
#4: Shenzhen
Points: 96,239.65
# of 150m+ buildings: 517
2010-2020 growth rate: 227.29% to 272.94%

From Flat on 500px
If I actually had accurate data, Shenzhen would have a decent chance of being #1 on this list. This juggernaut of a city took the title of China's largest skyline from Shanghai, and is not looking back. For years Shenzhen was the fastest-growing city in the world, and now its skyline is the fastest growing (in absolute terms) - the city of 12 million sits at the nexus of the Pearl River Delta, an urban area of over 70 million. Trade and proximity to Hong Kong, its special economic status, its port, and huge amounts of investment propelled this 50-year old city to first-tier status, and the city is a major global high-tech hub, hosting the headquarters of Huawei and DJI.
Shenzhen's tallest skyscrapers are located in its downtown right near the border of Hong Kong, in Nanshan, Luohu, and Futian. A single picture does not do this city justice. At night, Shenzhen transforms into a cyberpunk utopia of neon light shows, billboards, and streets. With a whopping 14 supertalls under construction, it seems nothing can stop Shenzhen from becoming the world's premier skyline.
#5: Busan
Points: 95,897.18
# of 150m+ buildings: 103
2010-2020 growth rate: 84.13% to 84.96%
Busan by Jens-Olaf Walter, on FlickrAt first glance and many glances after that, Busan looks like it should not be on this list. This city of under 4 million people manages to boast 103 skyscrapers and 4 supertalls - a very impressive feat. Despite Busan's steady or declining population it managed to almost double the size of its skyline. Perhaps this panorama on Wikipedia will give one an idea of how expansive its city is.
Thanks to its coastal location Busan's skyline gives the impression of being more appealing to look at than Seoul's. Like Seoul, many of Busan's towers are residential towers located away from the city. Busan's most prominent cluster is located in Haeundae, a rich coastal community near Haeundae Beach, one of Korea's most popular beaches. This has led to high real estate prices, prompting the development of Marine City and Centum City, two of Busan's most prominent developments. The line of towers stretching along the beach is reminiscent of many other beach resort towns, particularly Brazil's Balneario Camboriu.
#6: Moscow
Points: 74,613.19
# of 150m+ buildings: 44
2010-2020 growth rate: 45.97% to 46.69%
Moscow by Sergey Aleshchenko, on FlickrRussia's capital has a surprisingly long history with skyscrapers. Thanks to its Soviet past, miles of concrete apartments dot the Moscow cityscape that provide Muscovites with a place to live. These "commieblocks" can be easy to miss when glancing at the newer MIBC district. Moscow is vast in expanse, and much like Seoul, apartments can be found far, far away from the city centre, as shown here, here, or here. But before 2000, the real star of Moscow's skyline where the "Seven Sisters", seven iconic Stalinist-era skyscrapers built from 1947 to 1953. In particular, the Moscow State University, the tallest of these, is a staggering (at the time) 240 meters tall.
After the fall of the USSR the conception of the MIBC came into being, and produced what is definitively Europe's tallest skyline. At first a sparse collection of business towers, through the 2010s it continued to grow in scale and scope, perhaps in contrast to Russia's fluctuating economy. At the same time, Moscow began a major revitalization program throughout the city that transformed its streets, parks, greatly increasing the quality of life in the city - and taller residential complexes, ones with distinct, bold, and unique designs - are becoming commonplace. With the MIBC still realizing its gigantic expansion plan, the future for Moscow is an exciting one.
#7: Singapore
Points: 69,660.63
# of 150m+ buildings: 103
2010-2020 growth rate: 49.86% to 63.07%

Singapore is much like its fellow financial hub Hong Kong in many ways. Both are politically and geographically restricted from the development of low-density or medium-density suburban development. Unlike Hong Kong, however, Singapore is much flatter, leading to a sea of high-rises that cover the island. Also unlike Hong Kong is the success of the local housing agency, the HDB, which tends to build towers with more colorful, dynamic, and variable (though not as tall) designs than the public housing blocks of HK or the towers of South Korea. Outside of Singapore's Central Area are more high-rises and even more high-rises (as seen in the picture), all the way north up to Sembawang.
This altogether makes Singapore's skyline quite pleasant when viewed from different angles. The Central Area has continued to develop, with the tallest building, Guoco tower, built in 2016. While its birth rate is quite low, Singapore is not burdened by geopolitical tensions like HK, and its economy, and therefore skyline, will likely continue to grow.
However, Singapore is the first city on this list to have no supertalls at all, due to the unfortunate height limit of 280 meters in the Central Area, which the U/C CapitaSpring will match. I don't see this changing soon, unless Singapore makes the wise decision to remove it in the 2020s.
#8: Incheon
Points: 68,550.61
# of 150m+ buildings: 136
2010-2020 growth rate: 125.54% to 125.97%
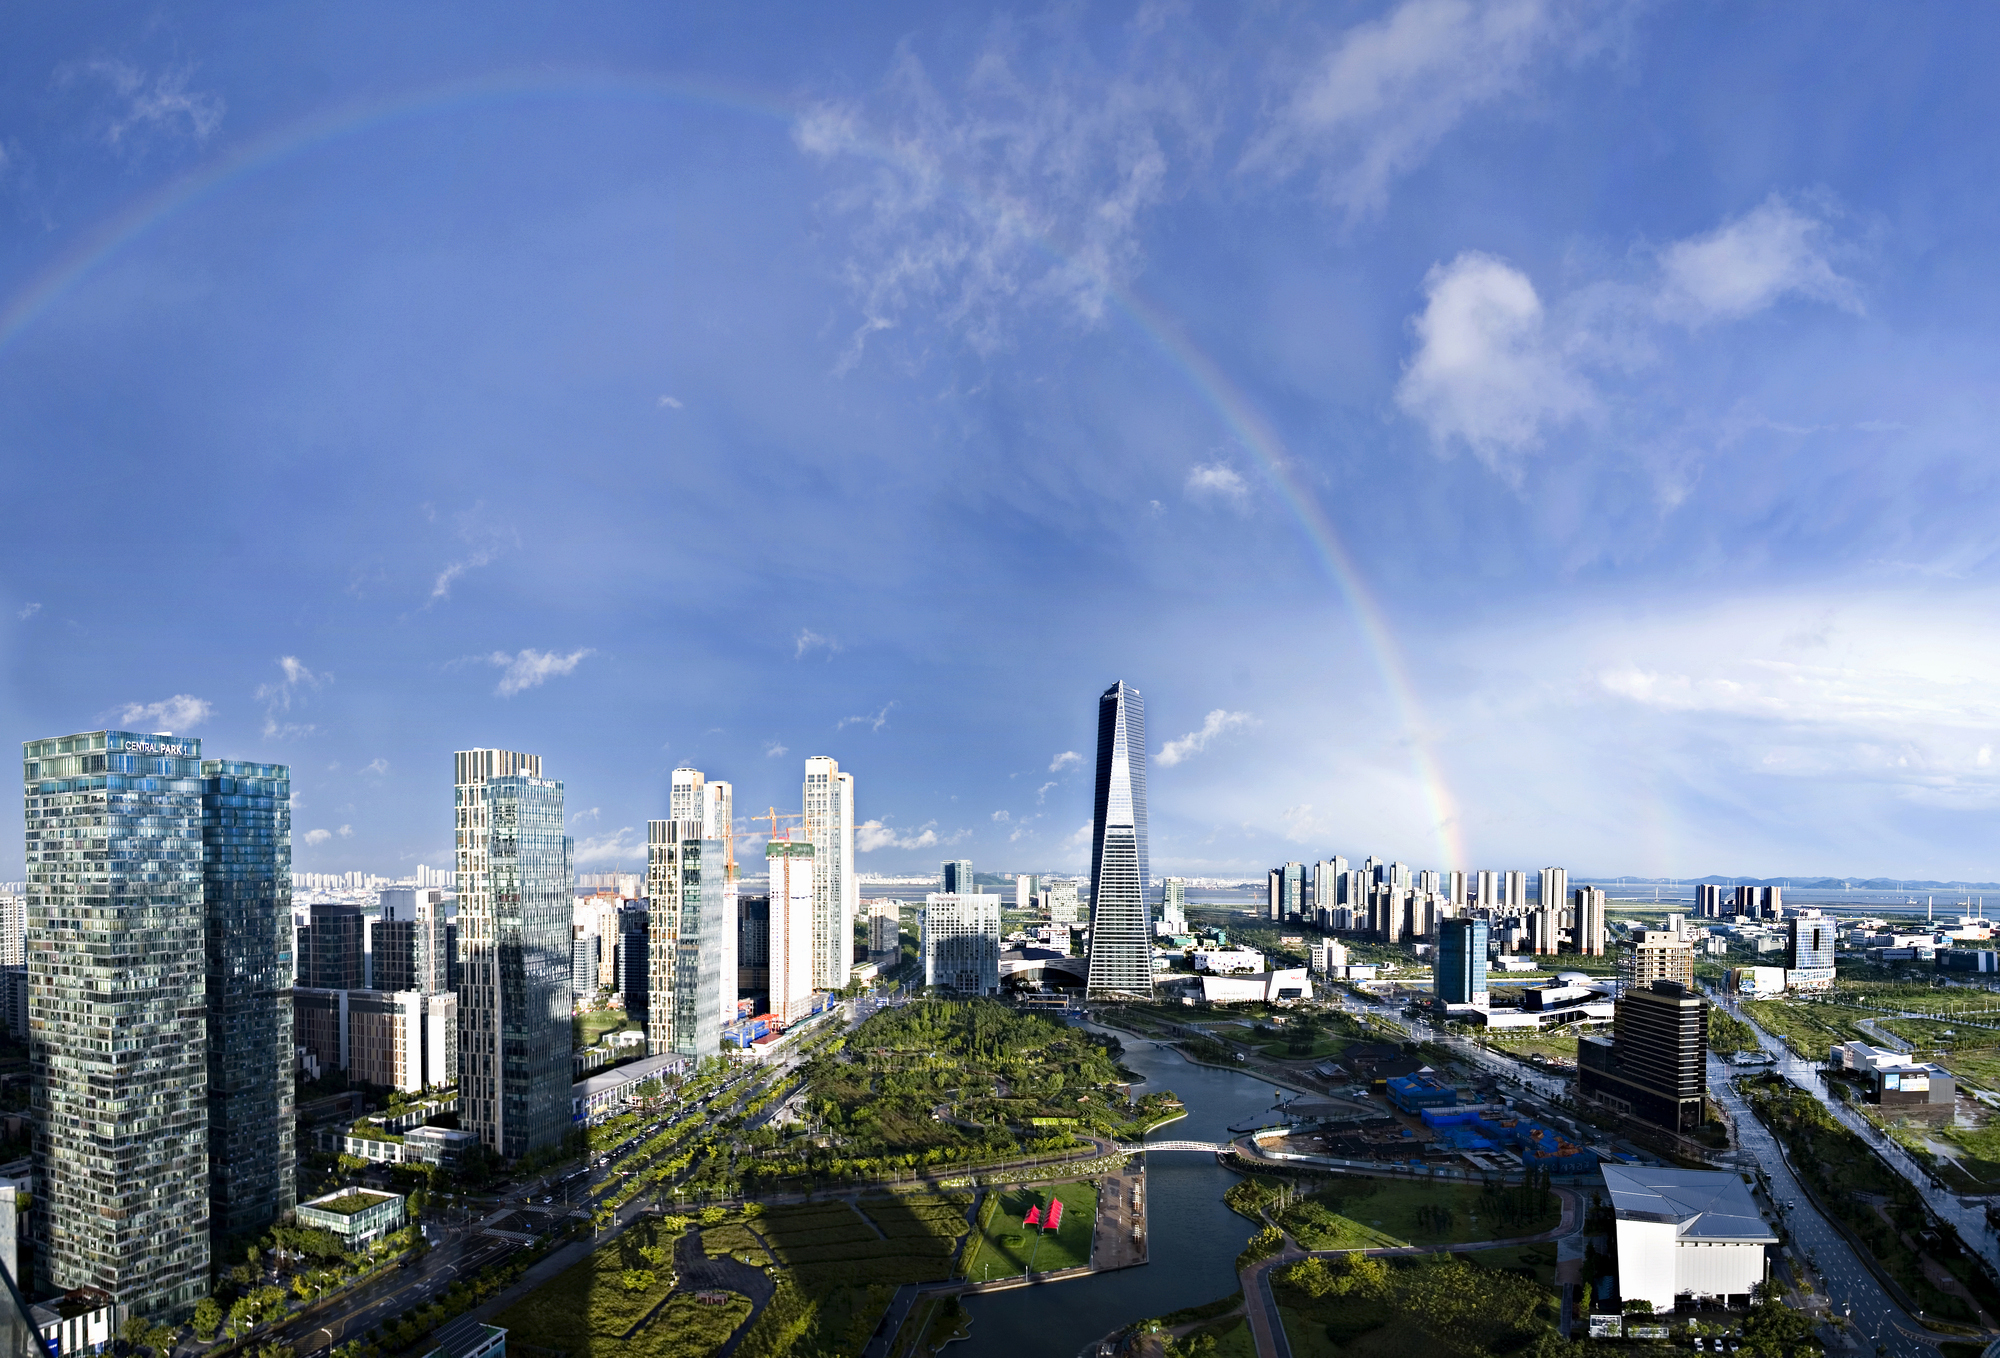
Yes, yes, I know what you're thinking. Another South Korean city? This surprisingly tall city is Seoul's largest suburb, and home to its main international airport. Incheon itself is also quite big, and is a lot like an extension of Seoul, though its buildings are mostly newer. Thus, Incheon lacks the flatter, wall-like apartment blocks of the 1970s, giving the city a modern look. Some proportion of these points come from the Songdo International Business District (shown in the picture) where its sole supertall is located.
Even in the picture above one can glance the high-rises faraway in classical Korean fashion, and it is this proliferation of high-rises that earns Incheon a mighty 68,000 points.
#9: Chongqing
Points: 67,910.58
# of 150m+ buildings: 184
2010-2020 growth rate: 90.86% to 108.20%
Chongqing by Daniel Cheong, on FlickrWhile not actually China's biggest city, Chongqing is a huge economic hub in Southwestern China, attracting rural migrants from its municipality and from Sichuan elsewhere. Its intense high-rise development is a product of its geography, with the Yuzhong district, where the Jiefangbei CBD is located, surrounded by water on 3 sides. Furthermore, Chongqing is notably hilly city even by Chinese standards, with buildings having two entrances on different levels and trains going through buildings. This unique cityscape gives Shenzhen a run for its money, with Chongqing looking just as futuristic at night.
With its expanding population and burgeoning economy, Chongqing's skyline will keep growing for decades to come.
#10: São Paulo
Points: 65,029.86
# of 150m+ buildings: 15
2010-2020 growth rate: 21.67% to 32.67%
São Paulo Skyline III by Henrique Oliveira, on FlickrOne may notice that São Paulo has a significantly lower number of 150m+ skyscrapers when compared to other buildings on this list. This is despite it looking like, and being, a concrete jungle. This will change in the coming years as the Brazilian megacity builds its tallest building, Figuiera reaching a respectable 180m+ meters. This developmental pattern typical of Brazilian cities as a whole, which are reluctant to build at taller heights despite living in cities that could easily support such towers economically, and with a populace that is attuned to living in apartments.
While these 10-30 story buildings fill the Sao Paulo cityscape in a similar manner to the ones of South Korea, the smaller width and footprint of Sao Paulo becomes apparent. Coupled with the fact that each building in Brazil is often a single development, the more vibrant, colourful, dizzying, and chaotic urban landscape of Sao Paulo is seen only in other Brazilian cities, and none with the immense scale that Sao Paulo boasts.
The direction that Sao Paulo's skyline takes in the future is affected by the city's growth rate, which remains respectable but is slower than its smaller Brazilian alternatives, as well as the economic situation in Brazil. I do hope to see a 200m+ skyscraper in Sao Paulo in the near future.
Feel free to check the document for the history of a city's skyline - I'll certainly add more of these descriptions in the future!